

Connect your data
Bring in Excel files, connect through APIs or capture information directly on screen.
Turn your data into reports, forecasts and business applications.
Bring spreadsheets, CRM, ERP and other business systems together on Microsoft Fabric. Create reports, ask Nova AI Analyst questions, build visuals with AI and run planning or operational applications. Start with the platform today, or work with us to prepare an application around your business.
Card required at signup for both trial routes. No charge until your 30 day trial ends. See both trial options.
Explore business applications Have a process in mind? Tell us what you need
 Fabric
 Azure
 Power BI
Upload your workbook, choose the data to process and follow it into reporting.
Before a spreadsheet is ready for reporting, there's usually a fair bit of work to do, and that's the challenge we see all the time. Checking the files. Correcting errors. Making sure the latest figures don't overwrite the history you still need. Let me show you how we bring that process together, from uploading a workbook to exploring the results in a report. Here, we're uploading one Excel workbook containing five datasets, US sales, UK sales, EU sales, budget, and forecast. Every worksheet is detected automatically, and we can choose exactly what to process. We'll take all five. As the upload runs, the files are validated, scanned for security, checked for duplicate records, and standardized before the data goes any further. And this is where it gets more interesting. The platform analyzes the columns, data types, and schema of each sheet, then checks whether a structurally similar table already exists. If it finds a match, we can append the new records to the existing dataset. That's particularly useful for recurring data like budgets and forecasts. Instead of overwriting the previous version, each revision can be retained historically and compared against earlier budgets, forecasts, and actuals. For this demonstration, we'll create new datasets and let the pipeline continue. The ETL now runs automatically : Validation and Cleaning, Metadata Extraction, Parquet Conversion, Lakehouse Update, Semantic Model Refresh, and Power BI Refresh. What started as a spreadsheet is now structured, reusable data. Once the data is available, a Power BI report can be created automatically, giving users an immediate starting point for analysis. What we're showing next is a separate, more developed report example. It's an interactive reporting environment designed to run meetings, moving from executive KPIs into regions, products, locations, budgets, forecasts, and transaction-level detail. But spreadsheets are only one part of the picture. We can combine them with CRM, Finance, ERP, and Operational systems, bringing everything into one connected data platform. So you can follow a lead from the CRM, through the sale, into the general ledger, and ultimately to the cash received in the bank, with one joined-up view of the entire journey. The result is one governed source of truth across the business, ready for reporting, forecasting, and AI-powered analysis. If any of this looks familiar, and you'd like to see what DataNova could do with your data, get in touch.
Start with your own spreadsheets and questions. Your standard workspace is available after signup.
DataNova is a reporting, AI and business application platform built on Microsoft Fabric. Upload spreadsheets and explore your data, or work with our team on an application for planning and everyday operations.
Bring in Excel files, connect through APIs or capture information directly on screen.
Work with scenarios, interactive charts, clickable KPIs and detailed drilldowns.
Use conversational analysis, AI visuals and custom predictive models for defined decisions.
Shape ownership, approval steps, roles and audit trails around the agreed application.
Connect reporting, planning and everyday action in a branded workspace. Start with an existing solution or build around your organisation.
Explore performance, investigate a movement and follow the supporting detail.
Connect budgets, forecasts, workforce plans and modelled scenarios.
Bring your data, responsibilities and approval steps into an application prepared with you.
Your 30 days begin after onboarding and environment setup.
Prefer a quick look? Watch the short demosConnect Finance & Operations or Business Central to customisable reporting for GL, payables, receivables, stock and shipping. We handle the Fabric data preparation and business definitions, with hosting and Managed BI available.
From source transaction to reporting, for configured and validated connections.
An agreed standard pack, with reports your team can customise.
Targets apply to agreed standard reporting packs once source access, required mappings and scope are confirmed. Initial data loads, custom extensions, complex consolidation and additional integrations can change the timing. We validate data freshness and agree delivery dates for your environment before implementation.
Choose how you want to work with your data. Start with questions and charts, then prepare briefings around your team's decisions.
Ask what changed, explore the numbers and follow up in plain English.
Ask your dataAvailable after signupDescribe a comparison, create a chart and refine the view for your audience.
Create a visualPrepared with your teamReceive a focused data briefing with a route back to the supporting detail.
Receive a briefing

Read feedback on the reporting, analytics and delivery experience behind DataNova.

Farah Mayet
Engagement Manager, VBM-Associates

Aanjli Sohal
Finance Director, Royal Voluntary Service

Mike Mendoza
Executive Director, eClinical Technology Strategy and Biometrics, TFS HealthScience
Explore on your own, or work with us to prepare an application around your business.
Go from your own spreadsheets to reporting, analysis and practical data tools.
Choose a platform plan for reporting, AI analysis, visuals and DataApps. For FP&A, forecasting or another prepared business application, agree the setup and ongoing scope with us. Both routes offer a 30 day trial.
Upload spreadsheets, ask Nova AI Analyst questions, create visuals and build DataApps. Every plan includes the core platform. Choose the user capacity that fits your team.
Connections, custom models and prepared business applications may need mapping or setup. We agree the scope and any implementation quote before an assisted pilot. See assisted trial terms.
Prices in USD, including applicable tax. Card required at signup. No charge until your trial ends.
Loading the current plans. If they do not appear, contact us for pricing.
The displayed amount is the platform subscription for the team, not a per-user price. Review your selected plan and renewal terms before confirming. Application setup and custom work are scoped separately.
For a prepared application, connected systems or a workflow tailored to your organisation. Agree the pilot and full implementation quote before you start.
Get ongoing help with your data, reporting and analytics. Your platform subscription is included. We agree the included plan, deliverables and support scope with you.
Explore Managed BIThe essentials about applications, preparation and your two trial options.
The standard platform gives you spreadsheet uploads, reporting, AI analysis, AI-created visuals and DataApps for table creation and data entry. Choose a plan and start through the existing signup process. A card is required at signup. You are not charged until the 30 day trial ends.
Yes. A card is required at signup for both the standard platform trial and the assisted application trial. You are not charged until your 30 day trial ends. The assisted trial lasts 30 days, starting after onboarding and environment setup. We agree the application scope, preparation and ongoing costs with you before it starts.
The assisted 30 day trial covers our finance, operations and customer application offering, including custom predictive models. We agree the workflow, prepare the environment and complete onboarding before your trial starts.
Your 30 days start after onboarding and environment setup. Environment setup typically takes one to two days. User setup, data connections and any agreed custom development can take longer, so we confirm the preparation steps and start date with you.
Start with an existing DataNova solution or commission an application around your requirements. We confirm the available starting point, configuration and any development needed before preparing an assisted trial.
Applications can use API connections, Excel imports or information entered directly on screen. The connection method, preparation and refresh requirements depend on your systems and agreed scope.
If an existing app fits without additional mapping or implementation, implementation and the 30 day trial are free, followed by normal subscription charges. If mapping or custom work is required, we agree the pilot and full quote upfront. After the 30 day trial, the quoted implementation fee and monthly subscription are payable only if you choose to proceed.
Share your requirements. No card or commitment.
Describe the result you need and the information you work with. We can help you identify a suitable existing application or scope a tailored pilot.
A card is required when you start a trial. An enquiry does not start a subscription or commit you to a project.
Revenue, margin and an active customer can mean different things in different businesses. We bring your sources together and prepare the rules, relationships and KPI definitions that reporting and Nova AI Analyst need.
Land data in the Fabric lakehouse while retaining its source context.
Standardise fields, align identifiers and prepare consistent relationships across systems.
Shape curated data around your organisation, with agreed definitions for the measures people use.
Use the agreed definitions in reports and apps. Nova AI Analyst connects through MCP to your governed semantic models for business context.
Posted invoices or orders? Before or after credits? Which entities, currencies and accounting periods? We agree the definition so your reporting and AI questions use the right basis.
Features
Stop rebuilding the same numbers in separate spreadsheets. DataNova brings your sources into a Fabric lakehouse, prepares the data and models your business rules, relationships and KPIs. Use that shared foundation across Power BI, Nova AI and your business applications.

Direct Data Connections
Connect files, databases and available APIs. Automate agreed refresh schedules so your team spends less time collecting data.
Your data is protected at every stage - from ingestion to insight - using Microsoft-native security, isolation, and governance controls.
Tenant Isolation
Separate customer workspaces and Fabric lakehouse environments help keep data access within the appropriate customer boundary.
ETL process
See how DataNova prepares incoming data, updates your lakehouse and makes it available to reporting and analysis. Connected systems and custom business rules are configured to your agreed scope.
Here's how it works:
1
File Validation & Security
Scan, validate, and secure incoming files.
2
Standardised Cleaning
Fix formats, standardise, de-dupe, and remove inconsistencies.
3
Metadata Extraction
Extract metadata for governance, cataloguing, and search.
4
Parquet Conversion
Transform files into optimised Parquet.
5
Update Lakehouse
Load data into Fabric Lakehouse.
6
Semantic Model Refresh
Refresh the data model to update tables, relationships, and measures, ready for AI analytics.
7
Power BI Refresh
Refresh your reports with the latest prepared data. Explore the results with Nova AI Analyst and create visuals with AI prompts.
Replace manual reporting, improve forecasts or connect an everyday business process. Tell us what you want to achieve and which systems you use. We’ll help you identify the right reporting pack, application or tailored solution.
No card needed to enquire. Scope and costs agreed before setup.
Finance, sales and operational visibility.
Budgets, forecasts and scenarios.
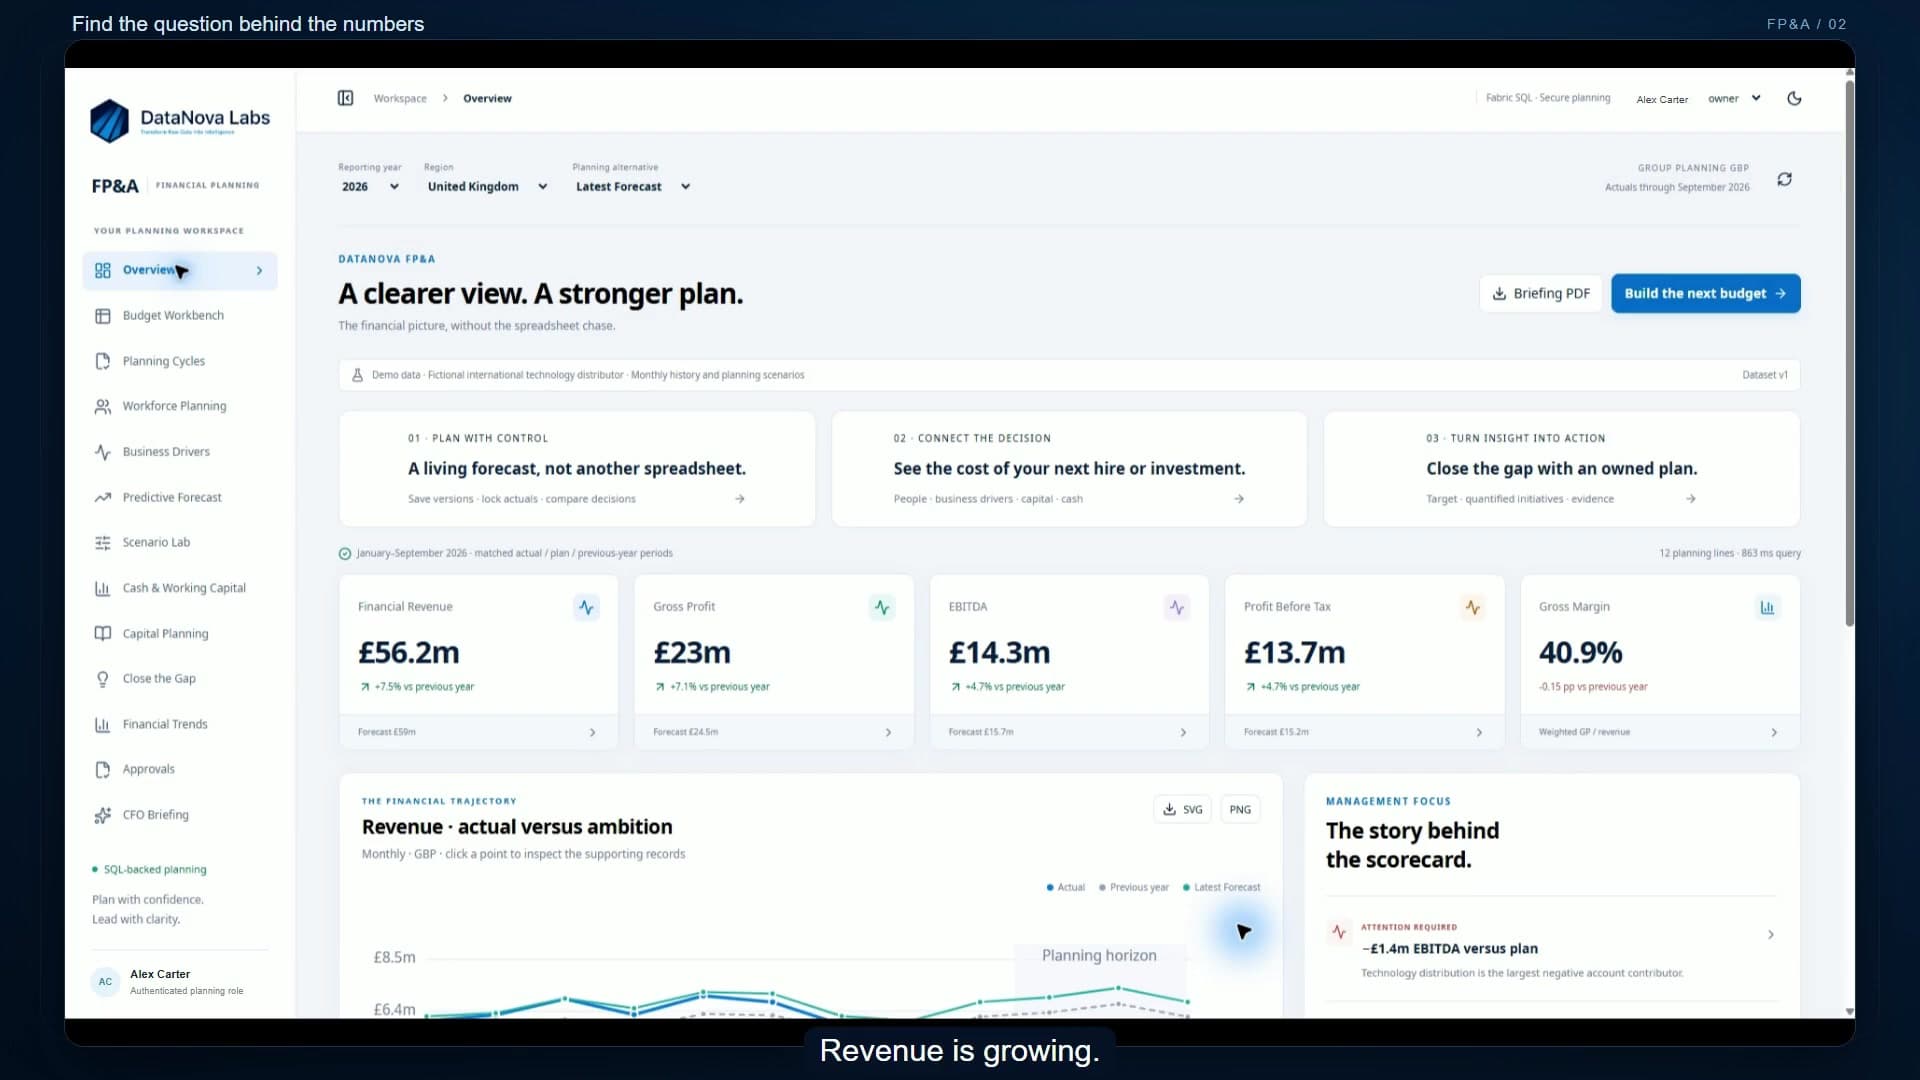
Every business has reports. The opportunity is to connect them to the decisions people need to make. At DataNova, we develop bespoke data, reporting, and intelligence platforms around your business. Aurelia is a working example using demonstration data. We will follow a question from the executive dashboard through financial evidence and custom machine learning to a briefing delivered by email. Revenue is $165.9 million, up 3.9%. That is a positive result. But gross profit has slipped. Gross margin is down more than one percentage point and revenue is below budget. More sales are coming through, but less of each sales dollar is becoming gross profit. That gives leadership a clear question. Where is the pressure and what deserves attention first? The supporting reports let us explore the question across sales, customers, products, purchasing, and operations. We can compare periods and investigate the available business dimensions. This is the value of a connected reporting application. The headline provides direction, and the supporting detail helps the team decide where to investigate. Finance reporting brings together profit and loss, the balance sheet, and the supporting ledger. The period, currency, and reporting scope stay visible so the team can understand what the figures represent before moving into the analyst's explanation. The financial views give leadership a common point of reference for the meeting. A movement can be discussed in the context of the statement, then followed into its supporting detail. The scope stays part of the conversation. The CFO analyst brings in the financial ledger perspective, which has a different reporting basis from the commercial sales view. Financial revenue is down 15.4%. Operating expenses have reduced by 7.6%. Costs are falling, but more slowly than revenue. The analyst turns these calculated measures into findings, priorities, and questions for management. We can follow a finding into a reconciled account movement, then into the supporting ledger in journal detail. The nine account revenue bridge also shows a zero reconciliation difference. That helps the team connect the total movement to the individual accounts contributing to it. The discussion becomes more focused. Which accounts moved? How much did they contribute? And what should the responsible manager investigate? Here, the complete five-line journal has matching debit and credit totals. That gives finance a practical route from explanation to evidence. Meeting view brings the discussion together for leadership. The key movements, investigation points, and management questions are presented in a format the room can work through. We can move from reviewing performance to agreeing the next action, then return to the detail when someone needs supporting evidence. the application becomes part of the management conversation. Budget versus actual reporting shows where performance differs from plan. For client deployments, we can also develop budget submissions, revised forecasts, operational updates, approvals, and locked versions. These are bespoke workflows designed around the client's controls, connecting people contributing information with management reviewing the result. Decision Studio takes us into the separate Atlas demonstration business shown in pounds. Now the question changes. What might happen next? What options do we have? And how should we prepare? The demand forecast uses a custom gradient-boosted machine learning model tested against a seasonal benchmark. 13 historical weeks were held back from training to assess performance on unseen data. At company level, weighted weekly forecast error was 3.29%, compared with 3.63% for the benchmark. Detailed product and site forecasts have greater uncertainty, so the level of the comparison matters. The future view extends the planning horizon by 12 weeks. This gives the team a tested basis for planning, with uncertainty visible alongside the forecast. We can develop models around the client's priorities, including revenue or cash forecasting, renewal risk, and scenario analysis, where the data supports them. We define the decision, test the model, and agree how its output will be used in the business. The forecast becomes more useful when we connect it to an operational choice. Under expected demand, the balanced stock policy models around 309,000 pounds of additional warehouse contribution and 1.46 million pounds of additional cash compared with the current policy. The held-out replay gives a more restrained result, around 133,000 pounds of additional contribution and 1.06 million pounds of additional cash. Under high demand stress, the balanced policy loses ground. A more resilient policy protects service better in the replay but commits substantially more cash. These are conditional scenarios. They help management weigh service, stock, and cash before choosing a policy and identify the assumptions to monitor afterwards. Manpower planning connects workload to capacity. At the baseline, the plan identifies no additional hires. At 1.75 times the workload, it identifies five hires with some early hours still uncovered. That prompts a better discussion than a headline headcount alone. Where is the gap? When does it occur? And what mix of hiring, overtime, or temporary cover should be considered? The site view makes the timing practical. Management can inspect where cover is needed and compare the staffing response before committing to a change. Pricing is another decision where the quality of the evidence matters. This experiment shows a possible improvement, but the uncertainty is too wide to establish a reliable gain. The current recommendation is to hold the rollout. A useful intelligence platform helps the team recognize both an opportunity and the point where more evidence is needed. The AI-assisted briefing brings the findings into plain language. What is positive? What needs attention? What actions to consider? And what to monitor next? In this demonstration, generated commentary is matched to the supporting data and scenario evidence. That connection matters. The insight should help someone act on the analysis and find the evidence when they need to check it. The briefing can reach the person who needs it by email. This demonstration has a weekday executive briefing configured and a test has already been received and approved. The email presents the important findings in a readable form with a route back into the application. The recipient can start with a summary and follow the detail where a decision needs more attention. For clients, this can become a morning briefing about the previous 24 hours, a weekly review of the important movements, or an alert when an agreed condition is met, margin pressure, spending beyond tolerance, or a forecast stock shortfall. The reporting period, source context, and delivery setup are visible. For a client solution, we agree how data is updated, how often analysis runs, and when people receive an update. Clear timing helps recipients understand the evidence behind each briefing. We tailor the measures, recipients, timing, and escalation rules around the business. The update should explain what changed, why it matters, whether it is positive or negative, and what to investigate or monitor next. This is proactive intelligence, bringing a focused, evidence-backed update to the people who need to make a decision. The experience can be shaped around the people using it, including clear light and dark presentation. Aurelia demonstrates what is possible. For your business, we build around your data, your processes, and your decisions, from the first input screen to the next management action.
Illustrative data and modelled scenarios. Your application scope and setup are agreed with our team.
Bring actuals, budgets and rolling forecasts into a shared planning workspace.
Explore applications 02Connect procurement, suppliers, assets and the decisions that keep your business moving.
Explore applications 03Bring cases, customer service and sales activity into a clearer view of what needs attention.
Explore applicationsExplore the full application offering with an environment prepared around your workflow.
A trial that starts when you are ready. Environment setup typically takes one to two days. User setup, data connections and any agreed custom development may take longer.
Review the selected plan, renewal and cancellation terms before confirming a standard trial. An existing app that fits moves to normal subscription charges after the assisted trial. For a pilot needing mapping or custom work, the quoted implementation fee and monthly subscription become payable after the trial only if you choose to proceed. We agree the scope and decision process upfront.
This Bronze, Silver and Gold approach is called medallion architecture. A Gold layer alone does not teach an AI your business. The definitions, relationships and analyst context must also be configured and checked. Source integration and business modelling are scoped with you.
Automated ETL
Validate, clean and transform incoming data through a configured pipeline. Agree the mapping and business rules before automating the process.
Your business definitions, connected
Model the measures, relationships and KPI definitions your teams actually use. Give reports and AI a consistent business context.
Power BI Embedded
Explore interactive reports and drill into the numbers inside your DataNova workspace.
Tenant Isolation
Dedicated customer workspaces and lakehouse folders support separate data environments and controlled access.
Nova AI Analyst
Ask questions in everyday language, explore variances and turn analysis into visuals. Review the supporting figures before acting.
A shared foundation for reporting, AI and applications
One
Move from spreadsheets to governed dashboards in
Minutes
Microsoft Azure Hosting
Built on Microsoft Azure and Microsoft Fabric. We discuss hosting, access and governance requirements with you before connecting business data.
Encryption & Access Control
Data encrypted in transit and at rest. Role-based access control and governed semantic models ensure controlled access to insights.
Controlled AI Access
Nova AI Analyst uses MCP to query governed semantic models, with your configured measures, relationships and access permissions. Review the supporting figures before acting.
Data entry, approvals and connected workflows.